🛠️ Developer Tools · AI · Guide
AI Debugging Tools for Developers:
What Actually Works in 2026
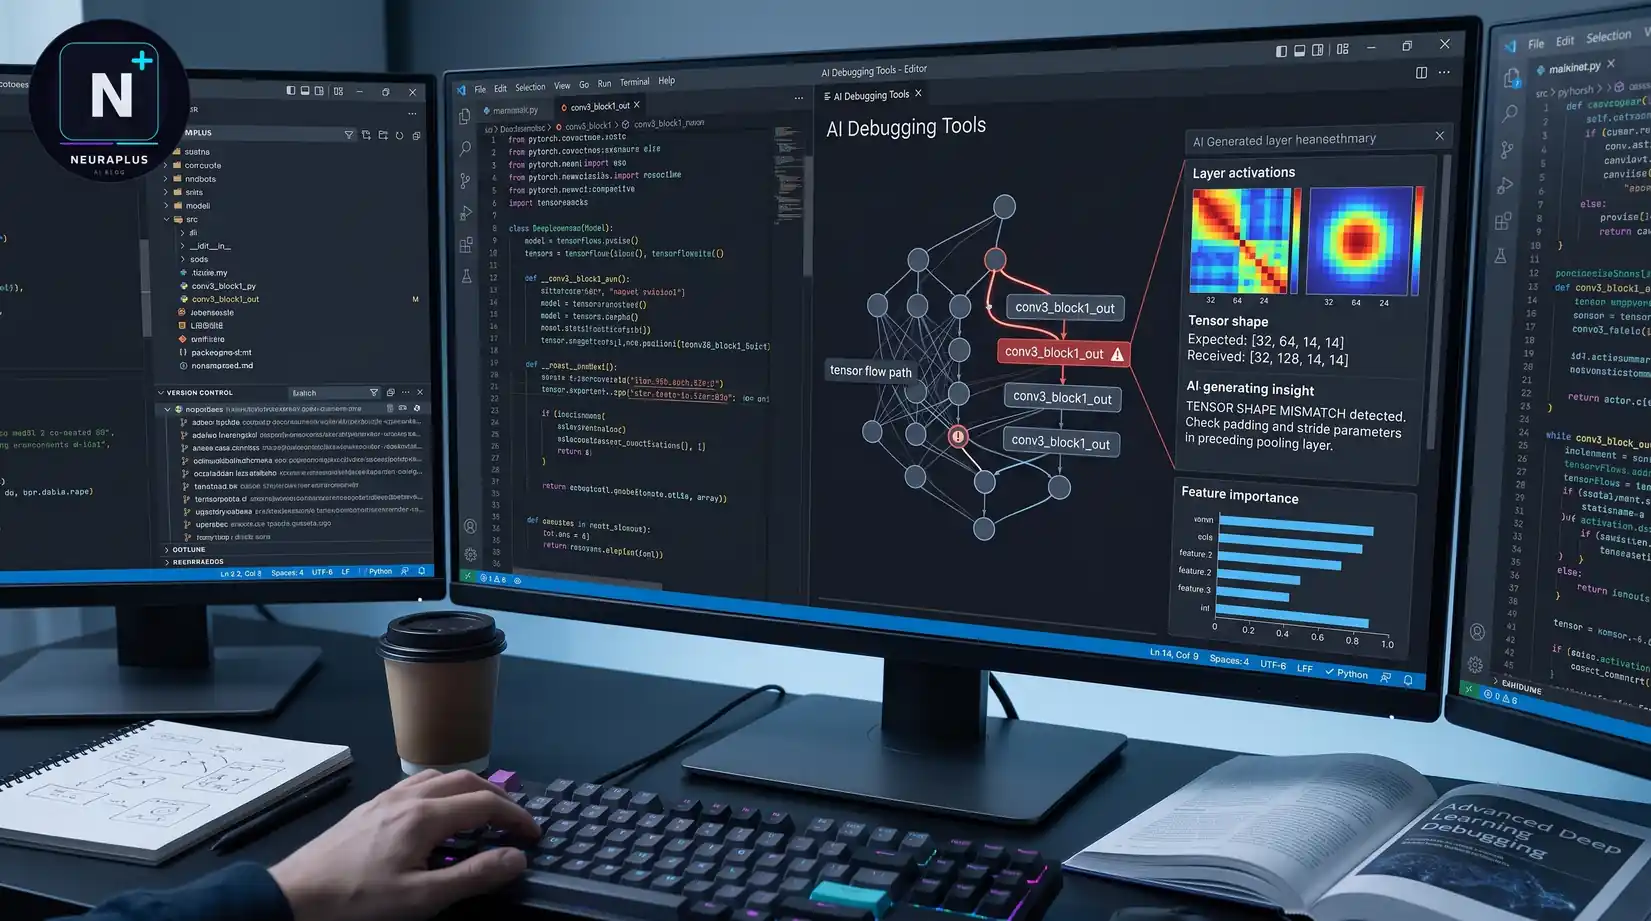
Every developer has the same story, just with different details. You're forty-five minutes into a bug that should have taken five. The code worked yesterday. It doesn't work today. You've re-read the same function six times and it looks completely fine, right up until you notice the bracket that's one line off from where it should be. That gap — between "something's broken" and "here's the actual cause" — is where AI debugging tools have quietly gotten genuinely useful over the past year, and it's worth understanding which ones actually help and where they still fall short.
🎯 Quick take: For everyday in-editor debugging, Claude and GitHub Copilot Chat cover most day-to-day issues well. For production runtime errors, Sentry's AI-assisted error grouping is the standard. For anyone building AI agents specifically, that's now its own category, with tools like Langfuse and Sentry's agent tracing built for exactly that.
Why This Category Actually Matured This Year
For a couple of years, "AI debugging tool" mostly meant pasting an error message into a chatbot and hoping for a decent guess. That's changed. The tools worth using now don't just react to a stack trace you hand them — several actively trace requests across your system, correlate logs and telemetry, and surface a likely root cause before you've even finished describing the problem. The distinction that matters is between tools that are reactive (you paste an error, they analyze it) and tools that are proactive (they watch your code or your production traffic continuously and flag issues as they happen). The most effective debugging setups in 2026 use both kinds together — proactive tools to catch obvious problems early, reactive AI for the harder runtime mysteries that only show up once real users are hitting your system.
In-Editor Debugging: What to Reach for First
| Tool | Best For | Notes |
|---|---|---|
| 1Claude | Complex, multi-file logic errors | Strong at tracing execution across files and spotting subtle logic bugs that simpler tools miss |
| 2GitHub Copilot Chat | JavaScript/TypeScript, React, Node stack traces | Repository-aware, integrates directly into your existing editor workflow |
| 3Codeium Chat | Budget-friendly everyday debugging | Free tier with no usage cap on core features, good for individual developers |
| 4Snyk Code | Security-related bugs, dependency issues | Proactive — flags vulnerabilities during development, can auto-apply simple fixes |
The single biggest mistake developers make with these tools isn't choosing the wrong one — it's using them wrong. Pasting a raw exception and asking "why is this broken" gets you a generic guess. Giving the model the actual error, the relevant function, what you expected to happen, and what happened instead produces dramatically better answers. Treat it less like a search engine and more like explaining the bug to a colleague who's smart but has zero context on your codebase — because that's functionally what's happening.
⚠️ A genuinely useful mental shift: the move in 2026 isn't to trust AI blindly on every error, and it isn't to treat it as a last resort either. Make it your first call when you're stuck, ask specifically instead of vaguely, and always verify the answer before you ship it. AI debugging tools are excellent at solving "context failures" — the kind of bug you can't see because you're too close to the code. They don't replace debugging skill; they give you a fast second opinion before you spiral into an hour-long rabbit hole.
Production Debugging: Different Problem, Different Tools
In-editor tools help while you're writing code. They don't help much once that code is live and something goes wrong for real users at 2am. That's a separate problem, and it needs separate tooling. Sentry, with its AI-assisted error grouping, remains the production-grade standard here — it clusters related errors together instead of showing you a thousand nearly-identical crash reports, and increasingly uses AI to suggest likely causes based on the surrounding stack trace and recent deploys.
Real production bugs are rarely as clean as "this function throws an error." A more typical 2026 debugging story looks like: the React component renders fine, but an API call returns a 401, because an environment variable wasn't set in an edge function, because the deployment script didn't propagate the secret correctly. That's not a single-file bug — it's a chain across four different systems, and it's exactly the kind of thing modern AI-assisted observability tools are built to trace end to end rather than leaving you to manually connect the dots across five different dashboards.
A New Category: Debugging AI Agents Themselves
This is genuinely new territory for 2026, and worth flagging separately because it works completely differently from traditional debugging. If you're building with AI agents rather than traditional deterministic code, your bugs don't look like stack traces anymore. An agent can retrieve the wrong document, call the wrong tool, or misread context — and still return a clean, successful-looking response. Traditional monitoring shows the request completed fine. It has no idea the actual output was wrong.
| Tool | Best For | Approach |
|---|---|---|
| Langfuse | Open-source, self-hosted agent tracing | Nested traces of model calls, tool usage, and execution paths |
| Braintrust | Trace reconstruction and replay | Full execution replay plus CI/CD quality gates |
| Arize Phoenix | Vendor-agnostic, OpenTelemetry-native tracing | Embedding clustering to spot pattern-based failures |
| Helicone | Cost spikes and latency debugging | Proxy-based observability across model providers |
Debugging an agent means reconstructing its entire decision path — what it retrieved, which tool it picked, what parameters it passed — to find the exact step where things went sideways. If you're working with local models via the Ollama API or building automation on top of Claude-powered agents, this category of tooling is worth setting up before something breaks in production, not after — retrofitting tracing onto an agent that's already misbehaving in the wild is a much harder problem to untangle.
The Prompt Matters More Than the Tool
Regardless of which tool you pick, the quality of what you get back is mostly determined by how you ask. This is the same lesson that shows up everywhere in good prompt engineering — specificity beats brevity every time. "This is broken, help" gets a shrug. "This function returns undefined on the third call but works fine the first two times, here's the function and here's what calls it" gets a real answer. Treat your debugging prompt the same way you'd write a good bug report for a human teammate, because that's genuinely the standard the AI is working against.
Should You Trust AI to Fix Bugs Automatically?
For simple, well-scoped issues — dependency version bumps, basic input sanitization, obvious null checks — several tools can apply fixes automatically with reasonable confidence. For anything touching authentication flows, authorization logic, or complex business rules, automatic fixes without review are genuinely risky, even when the AI correctly identifies the underlying problem. The pattern worth adopting: let AI narrow down where the bug lives and suggest a fix, but keep a human reviewing anything that touches security, money, or user data before it ships. This isn't a limitation of the tools being immature — it's just a sensible boundary regardless of how good the model gets.
Building a Debugging Toolkit, Not Just Picking One Tool
The common mistake is over-investing in one category and ignoring the rest. A great in-editor AI assistant doesn't help you when a production incident is actively happening. A great production observability platform doesn't help you while you're still writing the feature. Start with what's closest to your daily workflow — your editor's AI chat and one solid error-monitoring platform — then expand into agent-specific tracing only once you're actually running agents in production. There's no prize for adopting every tool in this article at once; there's a real cost to it in setup time and context-switching that often isn't worth paying until you actually need it.
Frequently Asked Questions
✅ Where to start: if you're only going to adopt one thing from this guide, make it the prompting habit — give AI debugging tools full context (what broke, what you expected, the relevant code) instead of a bare error message. It's free, it takes ten extra seconds, and it's the single biggest factor in whether you get a useful answer or a generic guess.